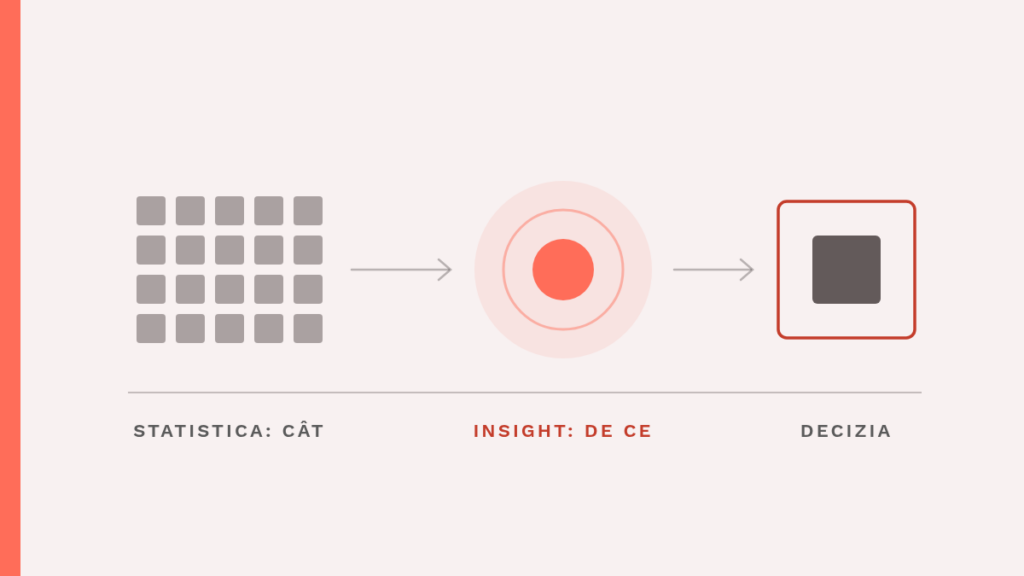
You have an insight (a discovery about the client that explains a behavior) when your sentence says why people do something. A beautiful statistic stops at “how many.” It looks good in a slide deck and leaves you with the same question you brought into the meeting.
A good example comes from a marketing book called Lemon. Orlando Wood of System1 wrote it, and the IPA published it on 15 October 2019. The title and the cover point to a famous ad, Volkswagen’s 1960 print ad “Lemon.”
1. What a beautiful statistic looks like
You spot a beautiful statistic fast. It is short, mildly surprising, and it fits any presentation, from the budget meeting to the year-end conference. “Most customers say they value authentic brands” is a sentence of that kind.
The sentence describes an average. It says nothing about why people want this, what “authentic” means to your client, or what you should do differently tomorrow morning on the phone, in the offer or on the packaging.
I wrote about the steps between fact, observation and insight in the article on the road from observation to insight. A statistic sits on the first step and shows you where to look.
Trouble starts when the team jumps from the first step to the campaign. The number becomes a slogan, the slogan becomes an ad, and nobody asks which client behavior should change.
2. What Orlando Wood did with the numbers
Wood started from data. He worked with System1’s Ad Ratings database, which holds more than 30,000 ads from recent years, and with the Effectiveness DataBank, the IPA’s database of effectiveness cases. As a fixed 30-year benchmark he used Coronation Street, a British soap that ITV has aired since 1960.
At first glance, what he found looks like a statistic. Over the years, ads piled up more of the elements Wood ties to the brain’s left hemisphere: fast, rhythmic cuts, text over the image, scenes with no link between them. System1 writes that these elements matter a great deal for effectiveness.
In its description of the book, System1 also recalls a finding from Peter Field’s studies of the Cannes awards. The effectiveness multiplier that award-winning creativity brought had “dwindled to almost nothing.”
That gives you three solid findings, enough for a good board presentation. They still don’t tell you what to change in next month’s ad.
3. The step that turns a number into an insight
The useful part of the book is the explanation. Wood took it from the work of researcher Iain McGilchrist, which System1 places “at the heart” of the book: the two hemispheres of the brain work on the same things, each in its own way, with a different kind of attention.
From there comes the sentence in which Wood ties the numbers together. An industry that got used to looking narrowly, in pieces and by indicator, ends up making ads in pieces, with text and cuts, and those ads move the people in front of the screen less and less. That explains a behavior.
In November 2023, Wood also wrote down the practical consequence. Right-hemisphere ads, with people who move, look at each other and live through a scene in real time, have a much better chance of capturing attention and stirring emotion. Left-hemisphere ads do slightly better on direct effects.
That last sentence gives you a decision. You pick the style of the ad by what you want to get: a sale today or a brand people remember. The figure of 30,000 ads, on its own, never told you that.
4. Four tests for your conclusion
You don’t have to agree with Wood’s neuroscience to learn from how he worked. His explanation may turn out wrong, but it tells you in advance what you should see in the data to contradict it.
4.1. Does it say why?
Read the conclusion out loud and ask whether it gives a reason or only counts. “Most of our clients are women from big cities” counts. An insight about the same clients would say what makes them choose, postpone or give up.
Try the form on a furniture company. “Our clients came from phone searches” stays a number in a report. A hypothesis that explains, still unverified, would look different: the client searches in the evening, from the sofa, and postpones the order until she can picture the piece in her own living room, so a photo taken in a home helps more than a studio photo.
4.2. Does the client recognize it?
Take the conclusion to real people and read it to them. Brainstorming (a meeting where the team throws out ideas) only gives you the team’s opinions about the client.
A client who hears a good insight nods and adds an example of her own. A beautiful statistic leaves her politely cold.
What a client says about herself has limits. I described them in the article on what your client won’t tell you.
4.3. Does it change a decision?
The third test is the simplest. Next to the sentence, write what you would do differently if it were true: another price, another message, another channel, another order on the offer page. If the box stays empty, you have a statistic.
With Wood, the box fills easily. If you want people to remember the brand, you put people, a scene and a place in the ad. If you want a click today, you accept a drier ad and you know what it costs you.
4.4. What would contradict it?
Ask what you would see in sales, in interviews or in store behavior if the sentence were false. A beautiful statistic has no answer to that question. An insight has one.
Take Wood’s sentence. If it were false, ads with people, scenes and places would not do better on attention and emotion than ads built from text and fast cuts. You can measure that on your own ads before you buy airtime.
What to remember
An insight explains why people do something, lets the data contradict it, and changes a decision about price, message or channel. A beautiful statistic impresses you only in a meeting. Four tests are enough. The sentence (the insight, put into words) says why, the client recognizes it, it changes a decision, and you know what would contradict it.
Brand Mentors
I work with companies through Brand Mentors
There I do brand strategy and consulting, starting from consumer psychology. You will find the services on brandmentors.ro.
Go to Brand Mentors