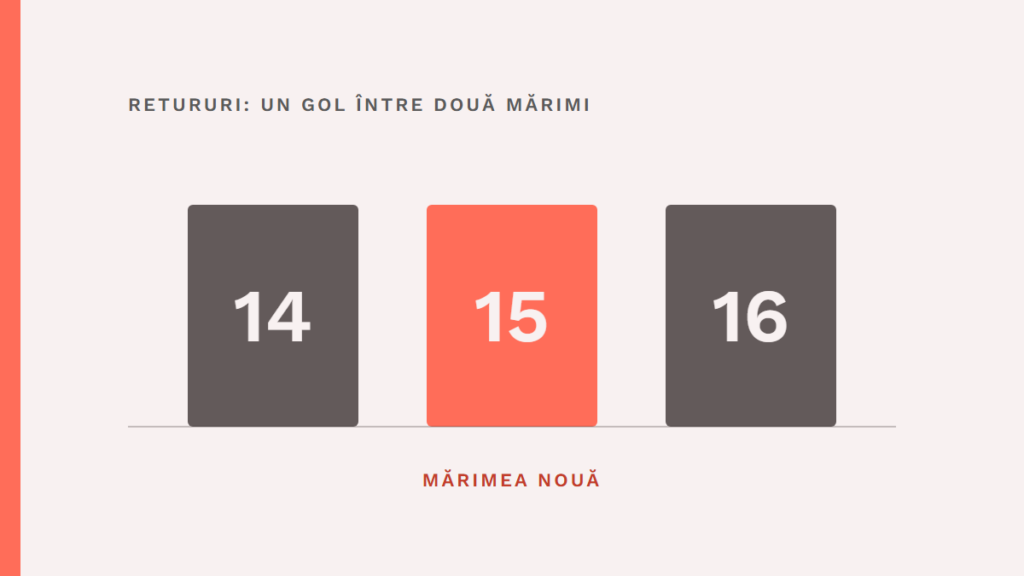
In the returns, Good American saw customers who sat between size 14 and size 16, and size 15 started from them. The story is a good case for an insight, a discovery about the customer that explains a behaviour. It also shows how long the road is between a figure and a product decision.
The starting point is the “Frontier CMO” report, produced from the podcast of the same name. Google sells AI and YouTube, so the source has an interest. The figures in the report are declared by companies, with no public methodology, and that is why the story of size 15 is checked against the press from 2018 and 2019.
1. What the report says
According to the report, Emma Grede, head of Good American, put customers’ comments next to the returns data. That is how she saw a peak of returns at sizes 14 and 16. She decided to invent size 15 for women who fall between the two sizes.
Retail objected. The report says retail buyers saw clothes for teenage girls in odd numbers and believed the market would not understand, an objection that the press from the time I consulted does not mention. The report’s claim stands as it is.
Grede says in the same report: “Customers don’t necessarily know they need that thing.” Customers do not necessarily know they need a thing.
2. What the fact actually was
The press confirms the core. Size 15 appeared in September 2018, in the Good Curve line, and HuffPost notes the official launch in the same month. The figure that started it all, however, appears in several versions.
Refinery29 writes in September 2018 that, since the 2016 launch, 50% of returns were in sizes 14 and 16. In an Entrepreneur article from November 2018, Grede says the two sizes came back twice as often as the others. In an interview from April 2019, she speaks of return rates 50% higher, and HuffPost, in March 2019, quotes her with 50% more returns than in any other size.
These are three measured things: a share of all returns, a ratio of one to two, and a difference in rate. The underlying data are not public, so it is not possible to establish which wording is exact. The lesson holds for any firm: before you explain a figure, find out what it measures.
3. From figure to observation
Returns show where it hurts. The reason is missing from the table. A return can come from colour, material, delivery or cut, and the table puts them all in the same column.
In Entrepreneur, Grede describes what else the team did: it digs through social media comments and listens for patterns in the data. About the customer, she says you listen to her “with words and dollars”. The comments are the words, the returns are the dollars.
From the two together came the team’s reading. Many customers were too big for a 14 and too small for a 16, Grede says in a 2019 interview. Refinery29 adds an explanation: the patterns for the two sizes differ across the whole industry, so women between them struggle to find something that fits.
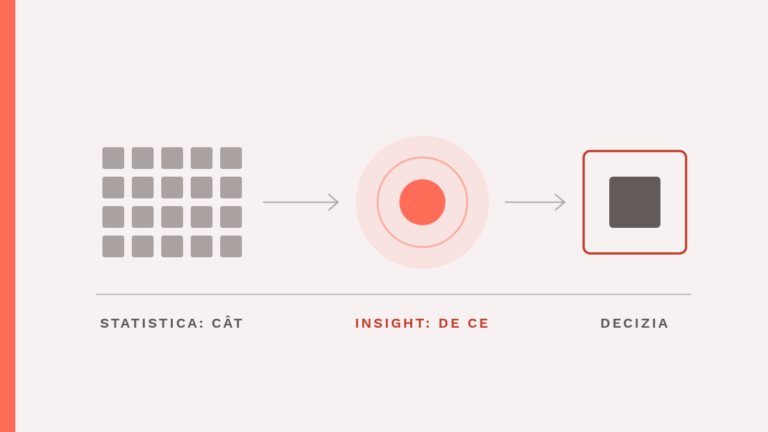
The observation describes a behaviour: customers return sizes 14 and 16. The insight gives the reason: the rail had no size for them. Here you can see a rule I propose for this subject: “A good insight starts from what the customer does, and is then checked against what they say.”
Returns are what the customer does. Comments show whether she recognises the explanation. The steps that lead from one to the other are described in the article from observation to insight, with examples from firms.
4. From insight to decision
An insight explains a behaviour. The decision comes separately.
The team could have answered in several ways, for example by correcting the cut at 14 and at 16. The report does not say whether Good American considered that. It says only what Grede chose: a new size, in an industry where retail buyers objected on the spot.
The decision came with a risk the data could not measure. The returns figure had no answer to the buyers’ objection about odd numbers. Here what counted was the judgement of a person who knows the brand and owns what follows, and the report puts this choice on the list of what AI does not touch, next to brand voice and creative concepts.
The story is from 2018, long before generative AI. The conclusion does not depend on the tool: a table of returns and a pile of comments need someone to read them together and ask why.
5. How you apply the story
You can follow a similar path with the data you already have. There are four steps.
First: choose a behaviour signal, for example returns, cancellations, complaints or rescheduling requests. Second: find out what the figure measures (a share, a rate or a ratio) and write it down once, with the source. Third: put customers’ words next to it, from messages, reviews or phone notes, and look for what repeats from one customer to another, whatever product they bought.
Fourth: write the insight in one sentence and check it with two or three real customers, as in the article what your client won’t tell you. If they recognise it, you have a decision to make, and you write down who will challenge it and with what argument. For size 15, the objection came from retail.
Verifiable figures on the result of size 15 are missing from the sources I found. All that is known is that it was launched and that the brand describes it as developed directly from customer feedback.
What to remember
The figure shows where. Customers’ comments show why the problem appears, the insight connects the two, and the decision to build something new comes from a person, with its own risk. Before you explain a figure, find out what it measures.
Brand Mentors
I work with companies through Brand Mentors
There I do brand strategy and consulting, starting from consumer psychology. You will find the services on brandmentors.ro.
Go to Brand Mentors